After setting up Locations and Forecast Settings, follow the steps in the video above to activate your Daily Planner. The Daily Planner is available with our Pro and Platinum services.
What are Daily Planners?
- Our new Daily Planners are an improved and more detailed daily forecast. These planners include daily summaries, detailed hourly forecasts, contain warning triggers to visually see times of threat and provide graphs of the forecasted weather conditions.
- Completely customizable with temporal scale, color coding and parameters, they combine the visual threat matrix of the executive summary and the detailed forecasts.
Interpreting the Daily Planners?
- The first section of the Daily Planners is the Daily Summary for the location.
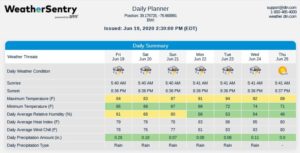
- Depending on the parameter thresholds, set in Forecast Settings, these boxes will include the parameter information and be colored green, yellow, red or no color. A legend is listed at the bottom of the planner, indicating the meaning of the green, yellow and red thresholds. All of these parameters are calculated from 12am to 12pm local time to the asset.
-
- Green boxes represent weather conditions below your “caution” threshold. You can view this as “everything is good to go,” or fair weather.
- Yellow boxes represent times of the day when users should be “on alert.” It indicates your weather conditions will be increasing and specific thresholds will likely be reached, remaining under the “critical value” range.
- Red signifies you will likely experience inclement weather. With values shaded red, it is imperative you remain weather aware. Note the time of day and what specific weather conditions are anticipated to be breached.
- No color means you did not set a threshold for this parameter.
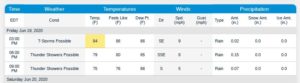
- Next, the detailed forecast is listed. The forecast values listed are the instantaneous values or accumulations at the times listed. The temporal scale and parameters you selected will be forecasted for in the following tables. If any of the parameters meet the yellow or red threshold then they will be color coded accordingly.
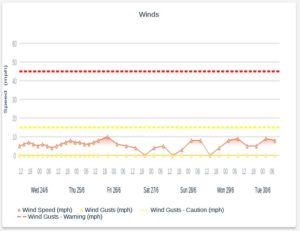
- Below the forecast tables are the graphical representations of the forecasts. Graphs are listed detailing the weather, temperature, wind, precipitation, probability of precipitation and marine parameters depending on where your asset is located and available parameters. These graphs will extend out to the extent of the horizon you selected.
Tips
- Within the Forecast Settings you can set the threshold warning that will appear in the yellow and red boxes and dashed lines on the graphs to give a clear understanding of when you need to be weather aware.
- All parameters selected in the forecast settings will be included on the graphs.
- The Timesteps setting determines at what frequency the forecast data will be displayed during each horizon. The hour used in each time step is determined by the delivery time of the Daily Planner. For example, for a Daily Planner delivered at 6am:
- A time step of 1 means the forecast will be displayed at 6am, 7am, 8am, etc. for that horizon
- A time step of 3 means the forecast will be displayed at 6am, 9am, 12pm, etc. for that horizon
- A time step of 6 means the forecast will be displayed at 6am, 12pm, 6pm, etc. for that horizon
- A time step of 12 means the forecast will be displayed at 6am, 6pm, 6am, etc. for that horizon
- A time step of 24 means the forecast will be displayed at 6am, 6am, 6am, etc. for that horizon
- The delivery times correspond to the time zone set when the asset was initially created. If the default “automatic” was selected, then the reports will generate and reflect the local time.
- The latitude and longitude for the position forecasted for is listed at the top of every page.
- If a parameter is listed as “-“ then there is no data available for that parameter.
- If the graphs appear distorted, try switching the view from portrait to landscape.
- If too many parameters are being forecasted for and cluttering the Daily Planner, try creating more than one location and receiving multiple forecasts, one with the most operation pertinent parameters and additional ones with more weather parameters.
- Below is a full example of a Daily Planner and as always if you have any questions, concerns or need any help configuring these please contact your Customer Success Manger or our Global 24-Hour Customer Service Team.