The WeatherSentry interactive map is the foundation of DTN’s web-based decision support platform, overlaying current and forecast weather data on a global map that offers different views to support your weather-critical decisions.
First
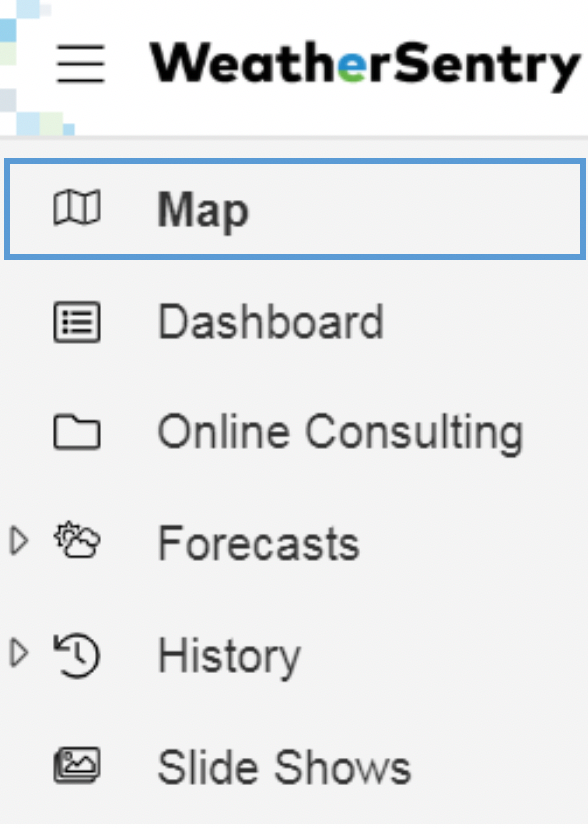
Start by selecting the Map icon in the WeatherSentry menu.
Layers
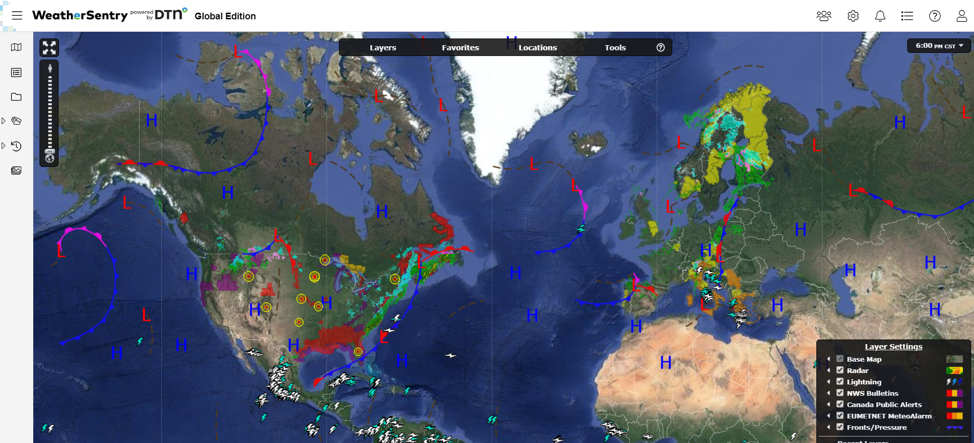
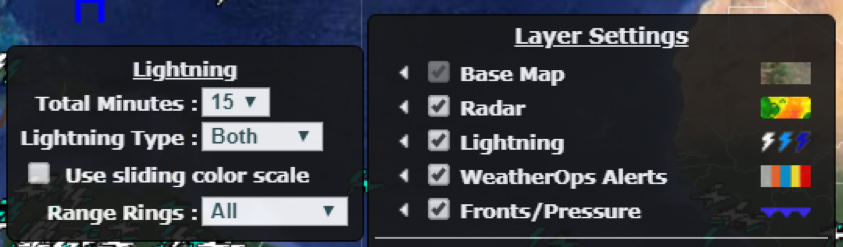
Enable weather layers by checking the box next to the weather content list. Several layers are able to be chosen at the same time, allowing a deeper analysis of current and forecast weather information. Popular layers include:
- Lightning
- Radar
- WeatherOps Alerts
- National Meteorological Services Bulletins
Radar
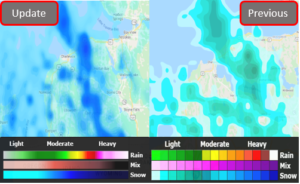
The WeatherSentry radar has been upgraded to a higher resolution. The radar is now a 1km grid with the color table beginning at 1 dBZ.
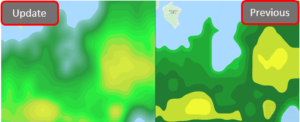
The new color palette is also smoother and transitions from one value to the next versus having blocks. Additionally, we’ve added future radar to add regions that can show a 90 minute forecast projection with 1km resolution. The regions for future radar include North America, Europe, Japan and Australia.
Settings
Each weather layer contains a settings display accessed by the arrow next to the layer. These layer settings control things such as transparency and time frame.
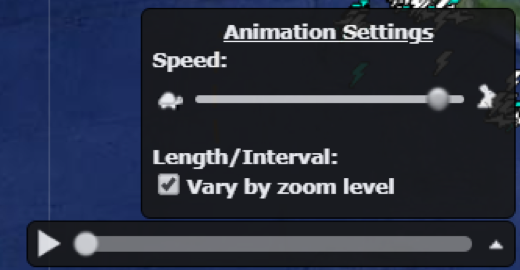
Animation
Some weather layers such as lightning, satellite and radar can be animated to get an idea of movement, growth and decay. When those layers are enabled, animation controls are displayed at the bottom of the screen.
Tips
Always looking at the same geography and weather content? Set up a map favorite here.
Rotate through a series of map views by setting up a slideshow here.