Storm Impact Analytics (SIA) is a premium service that uses a machine learning-based approach to provide damage and outage incident predictions for WeatherSentry Utility customers. Contact your Customer Success Manager for more information about SIA and SIA products.
Storm Impact Analytics
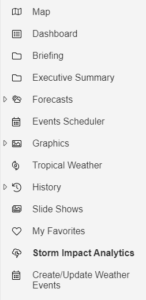
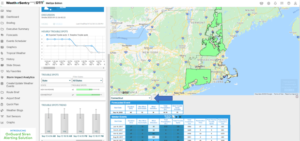
Properly provisioned WeatherSentry customers can access Storm Impact Analytics by selecting it from the menu on the left side of WeatherSentry Online.
The SIA screen is split between two windows: The Data Window on the left and the Map Window on the right
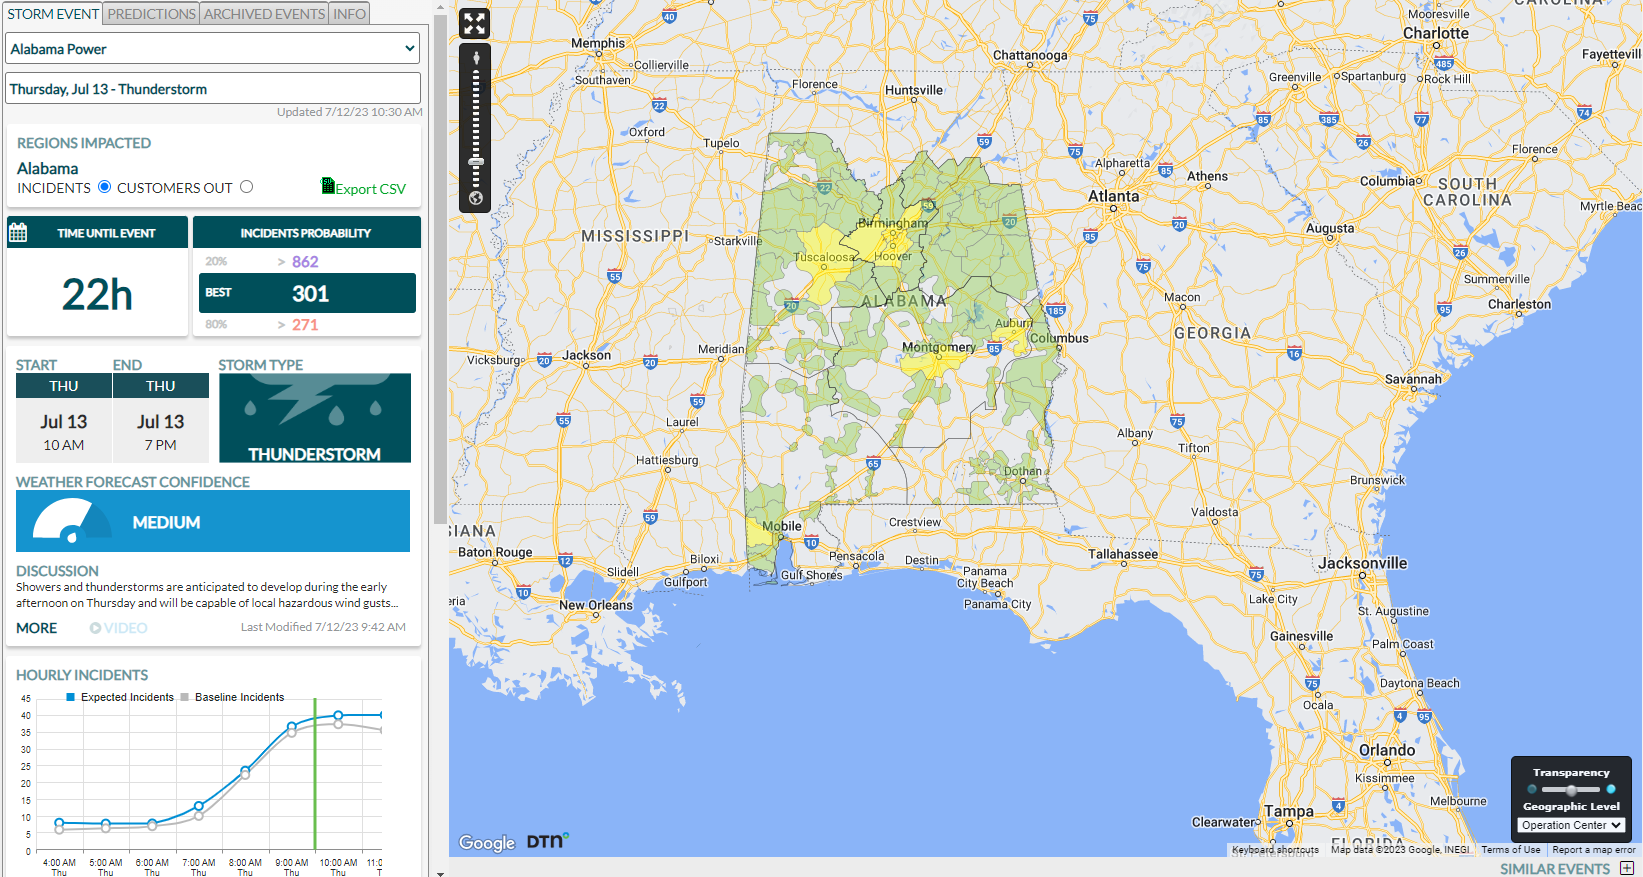
The Data Window shows:
- Current active events on STORM EVENT tab.
- PREDICTIONS of both incidents and customers out.
- Past events on ARCHIVED EVENTS tab.
- Event types and storm category thresholds on INFO tab.
![]()
The Map Window shows the spatial distribution of predicted incidents or outages.
Data Window
Within the Data window, you will see Event details. The Regions Impacted shows which region(s) within the Utility’s territory the event is predicted. For each event, “incidents” or “customers out” can be displayed in both the Data window and Map.
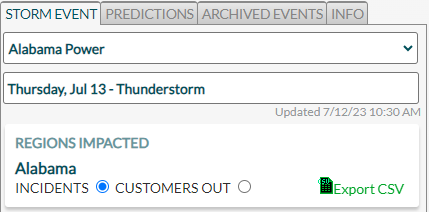
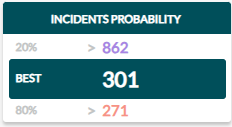
The Incidents or Customers Out Probability shows the probabilistic incidents or outages with best prediction for all regions included in the event. These show probability of exceedance (80% probability of exceeding 271 incidents, 20% probability of exceeding 862 incidents, with a best prediction of 301 in this example).
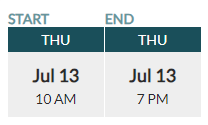
The Start and End Times show the predicted weather window time period. The Incidents or Customers Out Probability is now aligned with this time period, as opposed to the fixed 24-hour or 48-hour window previously associated with storm types. An event is a minimum of 6 hours, with no maximum time period.
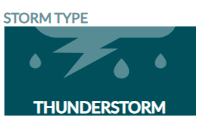
The Storm Type shows the type of hazard expected for the event. Storm types can be Extreme Temperature, Thunderstorm, Tropical, Winter or Wind.
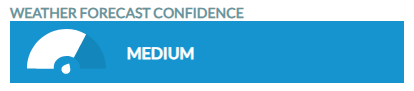
The Weather Forecast Confidence indicates the forecaster confidence based on the weather model input
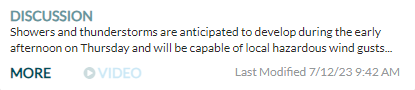
The Discussion contains the forecaster narrative of the storm event. Click on MORE for full discussion.
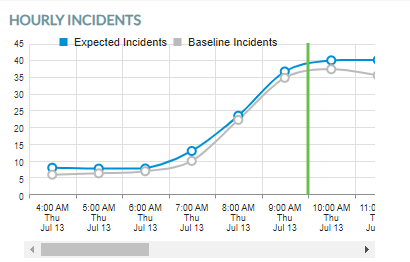
The Hourly Incident or Customers Out Forecast Widget shows the forecasted incidents or outages at an hourly resolution. The green vertical bars represent the start and end times as defined by DTN’s meteorologists. The blue line represents the incident forecast and the gray line represents the baseline incidents seen under “blue sky” conditions. It can be inferred that the difference in the blue and gray lines represents the expected incidents or outages attributed to environmental factors.
Incidents or Customers Out Widget
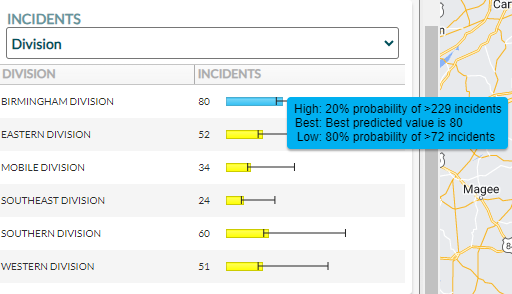
- This widget shows the predicted Incidents or Outages by Operating Geography. There is a filter and a dropdown that allows you to drill down to smaller geographic levels.
- The incident forecasts are shown using horizontal bars that represent the “best” forecast for each region using your threshold colors, with a gray plot overlaid showing the 80% probability of exceedance (low) forecast and the 20% probability of exceedance (high) forecast.
- Sort each column by clicking on the header. Hovering over the bars brings up tool tips that provide more detail about the prediction.
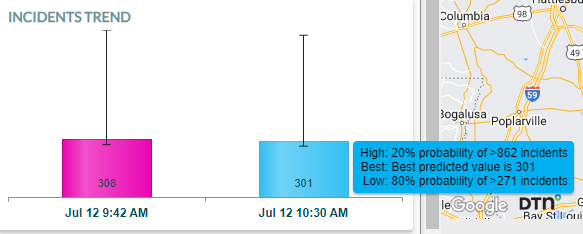
Incidents or Customers Out Trend Widget
The Incidents or Customers Out Trend widget is at the bottom of the Data Window. This charts the best prediction for past model runs, colorized by the threshold colors showing the 80% probability of exceedance (low) forecast and the 20% probability of exceedance (high) forecast. Users can view how model predictions trend over time, from initial event creation to event start time. Dates/times are in local time.
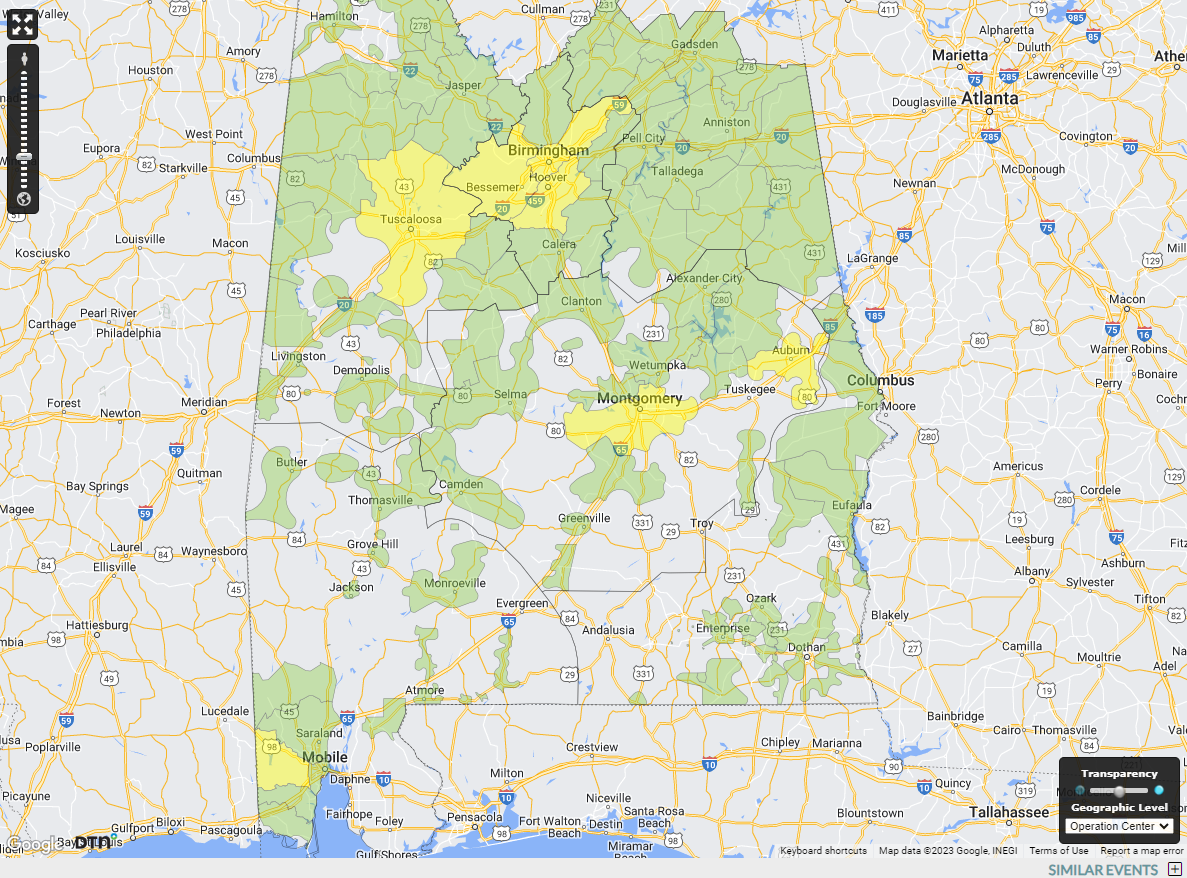
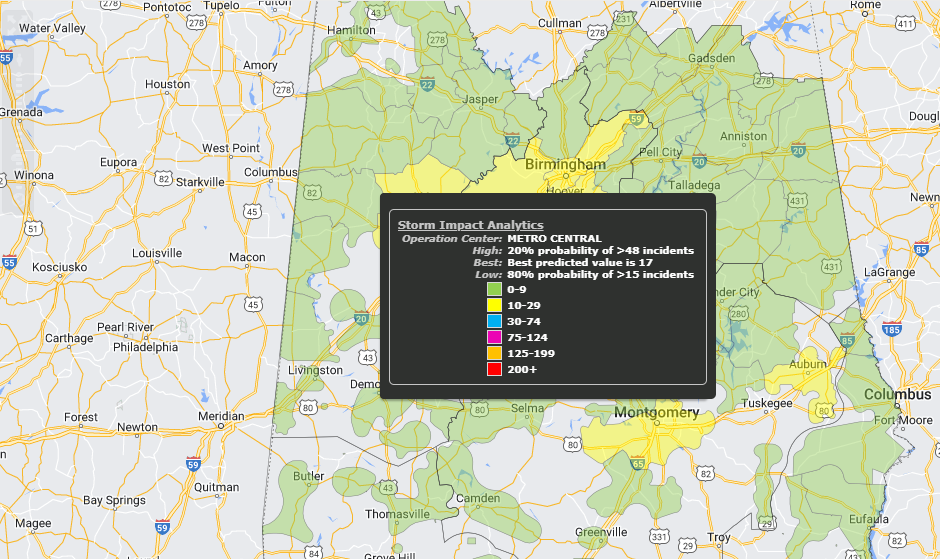
Map Window
The Map Window shows the spatial distribution of predicted incidents or outages.
The impacted regions are color coded based on the best prediction value. Hover over the region to display the best, high, and low predictions, as well as the color scale.
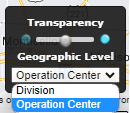
The Geographic Level Dropdown in the lower right corner can be used to control the map view. This allows users to drill down to view the predicted outages by smaller geography.
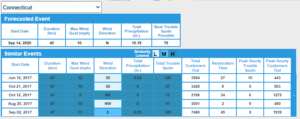
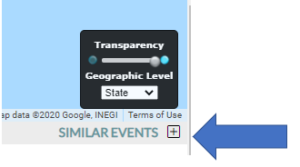
Similar Events
The Similar Events pop out is located in the lower right corner. Clicking on the plus sign opens the Similar Events Table Viewer, which displays the forecasted event and the five similar events below.
If you have multiple regions in your account, use the drop down at the top of the Similar Events viewer to select your region of interest.
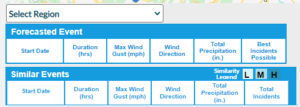
The Similar Events Table Viewer items are color-coded based on their similarity to the forecasted event: Low (light blue), Medium (blue), and High (dark blue).
Winter storms will use snow-to-water ratio for snow instead of the shown Total Precipitation that is used for non-winter events.
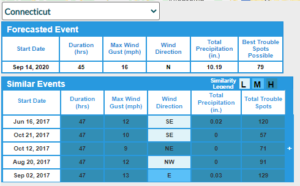
Clicking the plus sign on the right expands the table to reveal additional metadata about the historic Similar Events.
Click on the header for any column to sort.